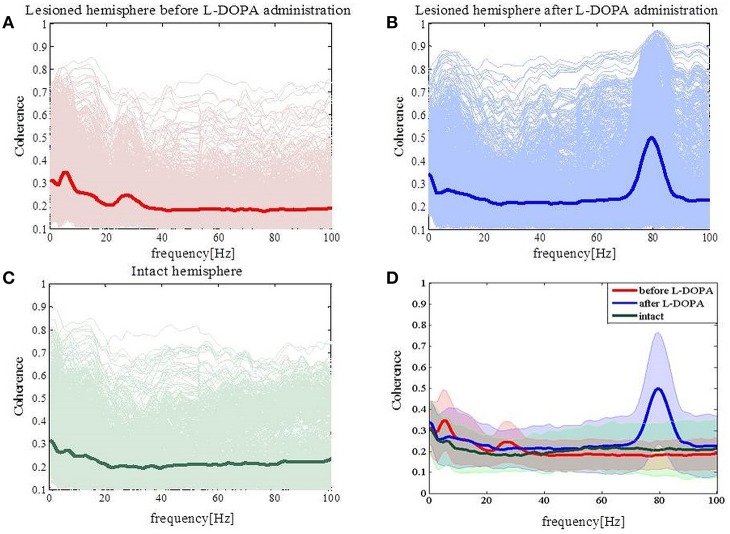
Figure 3.
Coherence spectra analysis. (A) Coherence has increased for low frequencies (<10 Hz) and for high beta frequencies in the case of the lesioned right hemisphere. (B) Coherence has peak values at high gamma frequencies (around 80 Hz). (C) In the case of the intact left hemisphere, we did not see any prominent increase in the coherence. (D) Average values of coherences for the intact and lesioned hemispheres. Shaded areas represent variability in the data as measured by the standard deviation.

