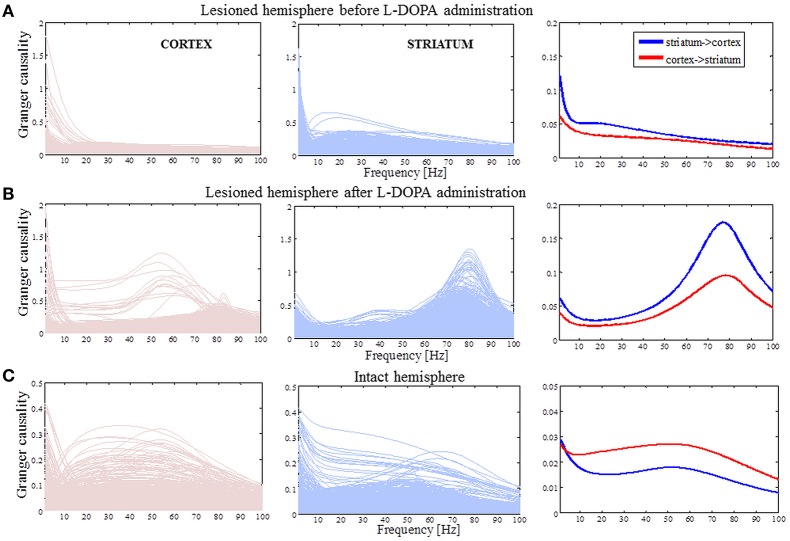
Figure 5.
Causality spectra analysis. (A) Granger causality for the lesioned hemisphere before levodopa administration. Left panel illustrates GC values when the cortex is assumed to be a source (driving striatal activity) and represents the traces for all pairs of the cortico-striatal electrodes. Middle panel shows GC values in the case where the striatum is assumed to be a source and the right panel shows averaged values. (B) The same analysis as in (A) for the lesioned hemisphere after levodopa administration. (C) Granger causality for the intact hemisphere before levodopa administration [the same analysis as in (A)]. The y-axes are different in order to improve visibility.

