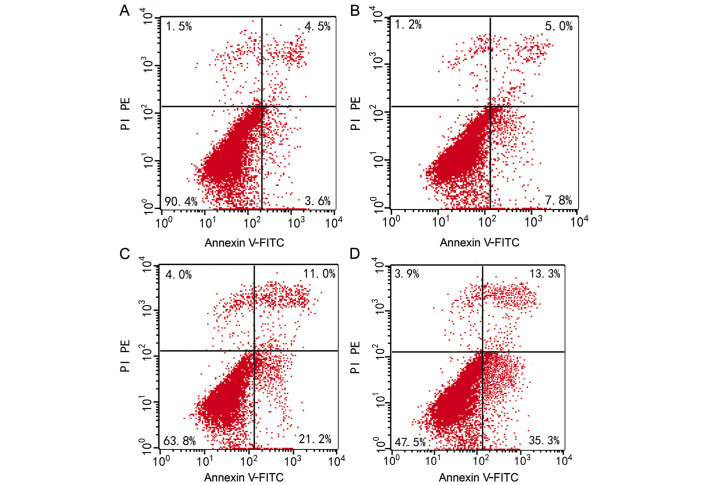
Figure 2.
QGY7703 cell apoptosis rates after being treated with different elemene concentrations for 24 h. (A) Untreated QGY7703 cells; (B) cells treated with 10 µg/ml of elemene; (C) cells treated with 20 µg/ml of elemene; and (D) cells treated with 30 µg/ml of elemene. Normal cells are distributed in the lower left quadrant of the scatter diagram, while early apoptotic cells are distributed in the lower right quadrant, necrotic and late apoptotic cells are in the upper right quadrant, and detection error within the acceptable range is in the upper right quadrant.

