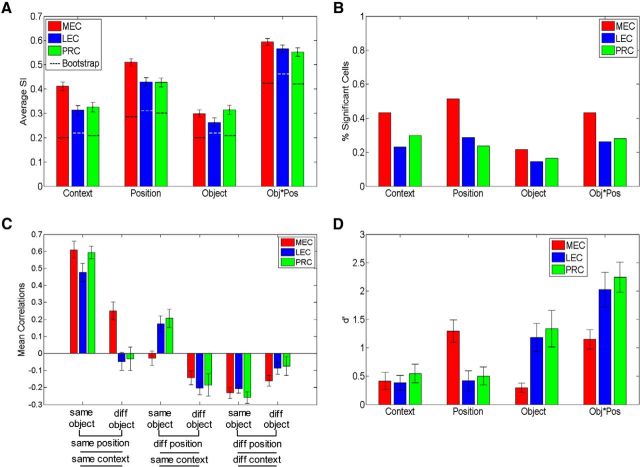
Figure 5.
Single-unit and population coding for task dimensions. A, Average SI ± SE for task dimensions during object sampling in PRC, LEC, and MEC. Dotted lines indicate the average SI values from a bootstrapped distribution in which the position and/or object identities were shuffled for each trial (preserving firing rates and patterns). Even with this stringent criterion to determine coding of task dimensions, we found significant coding for all dimensions in all three regions. B, Percentage of cells that significantly code for task dimensions after controlling for firing rate differences. C, Mean correlations coefficients ± SE for comparisons between object sampling events that are the same or different in distinct dimensions (object, position, context). Diff, Different. D, Strength of population coding of different task dimensions, measured as d′ distance between distributions of z-scored firing rates for context, position coding, object coding, and objects in specific positions (Obj*Pos).

