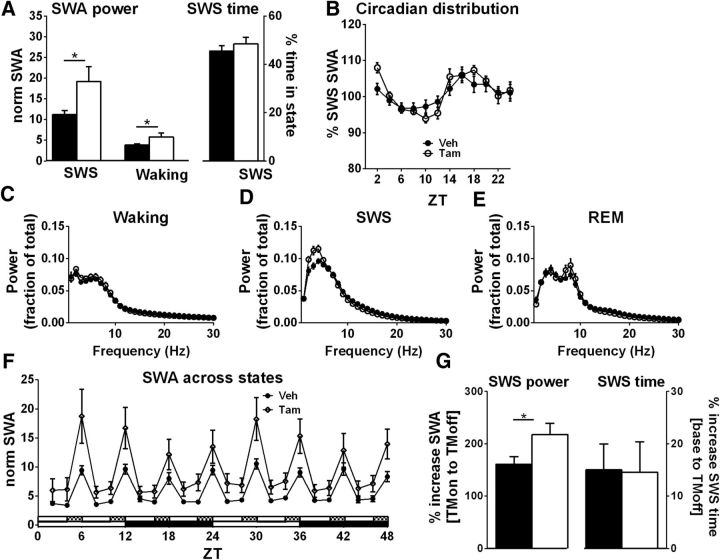
Figure 5.
Glial adenosine kinase knockdown increases SWA. A, Average, normalized SWA during SWS and waking (left y-axis). Under baseline conditions, fAdK;GFAP:CreER_Tam mice (open bars) show a significant increase in SWA during SWS and waking compared with Veh-treated mice (filled bars). Tam-treated mice spent the same amount of time in SWS compared with fAdK;GFAP:CreER_Veh mice (right y-axis). B, The circadian distribution of SWS-SWA is illustrated by the percentage SWA in 2 h bins of the average 48 h baseline SWS-SWA for each animal and is similar between groups. C–E, Power spectrum distribution in Tam- and Veh-treated fAdK;GFAP:CreER mice (open symbols indicate Tam; closed symbols indicate Veh) during waking (C), SWS (D), and REM (E). F, SWA across states is shown over 48 h of chronic, partial SD with 4 h/2 h cycles of SD and recovery. SWA is greater during both SD (TMon) and during the recovery period (TMoff) in the Tam-treated compared with the control mice. G, Tam-treated mice (open bars) show a greater percentage increase of SWA from enforced wake to SD recovery sleep (left y-axis, TMon to TMoff) compared with Veh-treated mice (filled bars). The same two genotypes were also compared for the percentage increase from baseline SWS time to SD recovery SWS time (right y-axis, base to TMoff). Unlike the greater increase in SWA in Tam-treated mice, both groups show similar increases in SWS time following SD.

