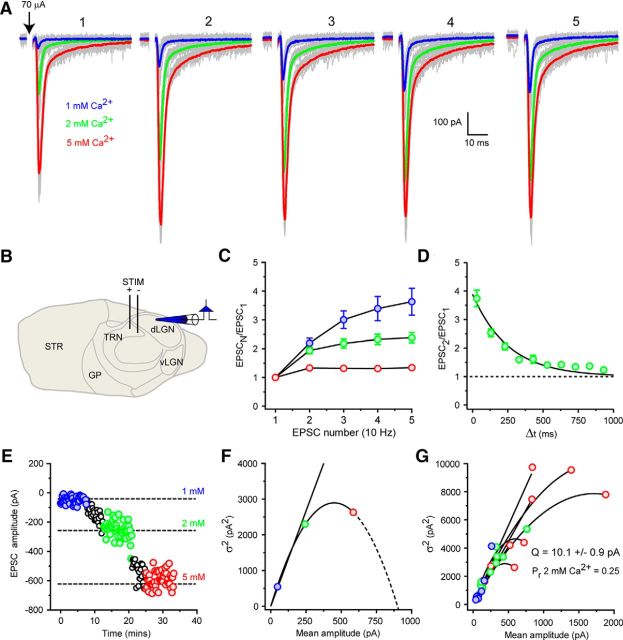
Figure 1.
Variance-mean analysis of CT EPSC quantal size. A, Trains (10 Hz) of evoked CT EPSCs in a representative dLGN TC neuron under varying extracellular Ca2+ concentrations. Blue traces represent mean EPSC 1 mm Ca2+. Green traces represent mean EPSC 2 mm Ca2+. Red traces represent mean EPSC 5 mm Ca2+. Gray traces represent individual EPSCs. B, Schematic of slice preparation showing placement of stimulating and recording electrodes. C, EPSC frequency-dependent facilitation typical of CT EPSCs. D, Time-dependent recovery of CT EPSCs from facilitation (n = 6). E, A typical experiment (traces shown in A) used for VM analysis of quantal size. Same colors as in A. At each Ca2+ concentration, 40–50 evoked EPSCs were collected. The increase in mean EPSC amplitude is accompanied by an increase of the variance of the response with increasing Ca2+ concentration. F, Plot of mean EPSC amplitude versus EPSC amplitude variance (σ2) for 50 trials at different Ca2+ concentrations. Same colors as in A. A second-order polynomial (quadratic) fit of the data yields a quantal size (Q, initial slope) of 10.7 ± 2.0 pA. G, Overlaid individual fits to data from 11 dLGN TC neurons. Mean values for Q and release probability in 2 mm Ca2+ (Pr 2 mm Ca2+) are shown.

