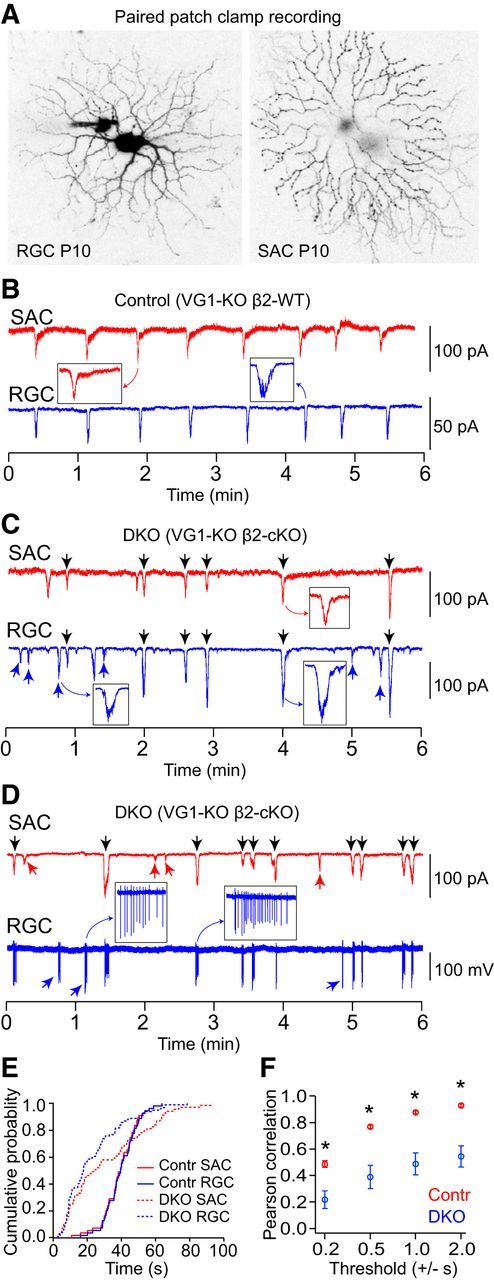
Figure 3.

Spontaneous activity in RGCs and neighboring SACs was desynchronized in VG1-KO/β2-cKOs at P10. A, Representative morphologies of a RGC and a SAC filled with AlexaFluor-488 and AlexaFluor-555, respectively, after paired patch-clamp recording. B, EPSCs recorded from a SAC and a neighboring RGC simultaneously in a VG1-KO/β2-cHet mouse at P10. C, EPSCs recorded from a SAC and a neighboring RGC simultaneously in a VG1-KO/β2-cKO mouse at P10. Spontaneous EPSCs were highly correlated between the SAC and RGC in the VG1-KO/β2-cHet mice but were desynchronized in the VG1-KO/β2-cKO mouse at P10. D, Paired recording of EPSCs in a SAC (whole-cell mode) and spiking activity in a RGC (cell-attached mode) from the retina of a VG1-KO/β2-cKO mouse at P10. C, D, Black arrows indicate synchronized events. Red and blue arrows indicate events that are not synchronized. E, Cumulative distribution of interevent intervals in SACs (red) and RGCs (blue) in VG1-KO/β2-cHet and VG1-KO/β2-cKO mice at P10. There was a wider distribution of interevent intervals in the VG1-KO/β2-cKO mouse (dashed lines). F, Pearson correlation between RGCs and SACs in the VG1-KO/β2-cKOs was significantly lower than in the VG1-KO/β2-cHet controls at all thresholds. *p < 0.05 (Student's t test).
