Figure 4.

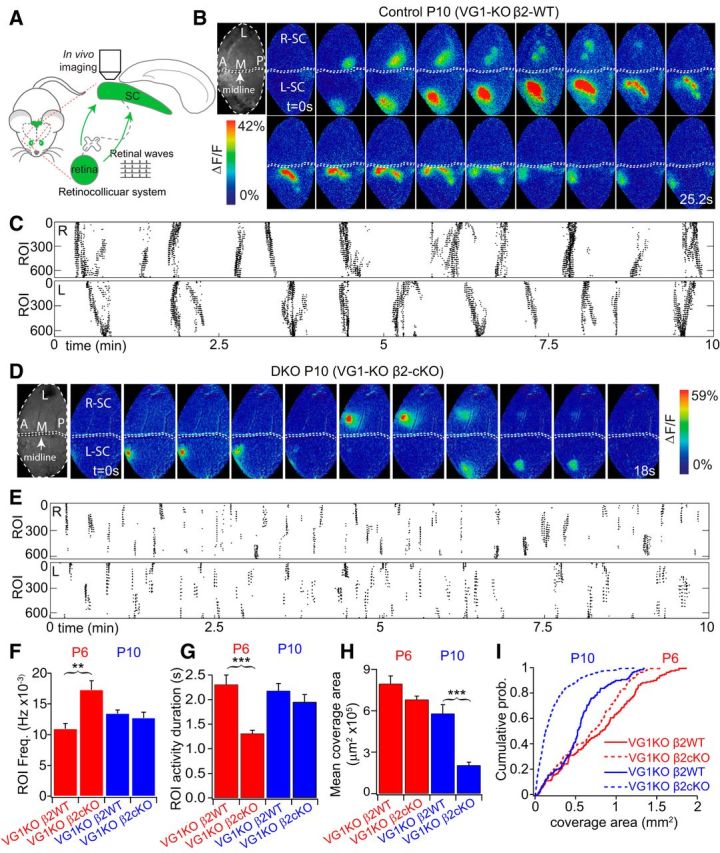
Truncated wave activity in vivo in VG1-KO/β2-cKO at P10. A, Retinal wave-imaging schematic. Retinal waves were imaged in vivo in topographically mapped axon arbors of RGCs in the upper layers of the SC through a craniotomy. Calcium activity in RGC axons in the SC was measured through viral expression of GCaMP6 in RGCs. B, Example of two wave montages from two hemispheres of a P10 β2-control mouse that lacks Vglut1 (VG1−/−/ChAT-Cre−/β2fl/+). Top, Grayscale images (left) represent the craniotomy over the SC. L, Lateral; M, medial; A, anterior; P, posterior (for this and all in vivo image figures). White arrowheads indicate onsets of waves in the right and left SC hemispheres (R-SC and L-SC, respectively). Arrows indicate propagation of retinal wave fronts. A clear, slowly propagating wave front was typical in heterozygous mice. Movie frames shown in montage at 1.6 s interval. All movies were acquired at 5 Hz. C, Raster plot of 10 min recordings from the same mouse. Each row in the raster corresponds to one 10 × 10 μm ROI in the indicated hemisphere. D, Example of three wave montages from a P10 SAC-β2-cKO mouse that also lacks Vglut1 (VG1−/−/ChAT-Cre+/β2fl/−: DKO). White arrowheads indicate onsets of spontaneous retinal activity. There was no clear propagating wave front in the DKO mouse; rather, correlated activity bursts repeatedly and synchronously activated small areas of the SC. Top, Grayscale images (left) represent craniotomies over SC. Movies were acquired at 5 Hz, and frames in montage are at 1.8 s intervals. Scale bars, 200 μm. E, Raster plot of 10 min recordings from the mouse shown in D. Each row in the raster corresponds to one 10 × 10 μm ROI in the indicated hemisphere. F, There was a significant increase in the frequency of synchronous spontaneous activity in a given ROI in DKOs at P6. However, spontaneous activity in a given ROI occurred at a similar frequency in DKO mice at P10 compared with VG1-KO/β2-WT controls. G, Activity duration was significantly smaller in the DKOs at P6 but similar at P10 compared with VG1-KO/β2-WT controls. Mean wave size (H) and cumulative distribution of wave sizes (I) in VG1-KO/β2-cKOs and VG1-KO/β2-WT controls at P6 and P10. Wave size was significantly reduced in the DKOs at P10. **p < 0.01; ***p < 0.001.
