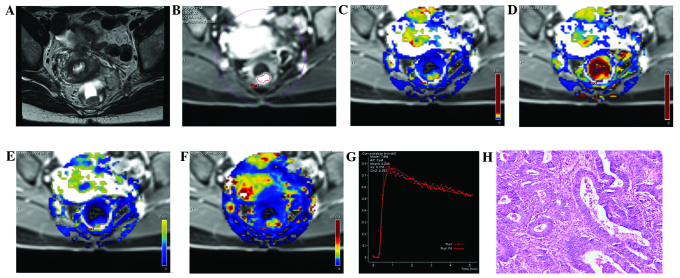
Figure 1.
MRI images from the same patient with rectal cancer, a female aged 48 years with blood in the stool for 6 months. (A) A T2WI cross section, revealing the local occupation of the rear intestinal wall. (B) DCE-MRI scanning image showing a marked enhancement of the rear intestinal wall, which was slightly higher than the surrounding regions. (C) DCE-MRI pseudo-color images of Ktrans. The yellowish-green area indicates the local occupation of the intestinal wall. Ktrans of the lesion area was 0.208, which was higher compared with the surrounding intestinal wall tissue (blue). (D) DCE-MRI pseudo-color images of Kep. The red and yellow areas indicate the lesion area, where Kep was 0.588. (E) DCE-MRI pseudo-color images of Ve. The yellowish-green area indicates the lesion area, where Ve was 0.370. (F) DCE-MRI pseudo-color images of iAUC. The red and yellow areas indicate the lesion area, where iAUC was 37.009, which was higher compared with the surrounding intestinal wall tissue (blue). (G) The DCE-MRI time-signal intensity curve of the patient, where the dashed line indicates the connection between data points and the solid line indicates the fitted curve, reveals an outflow pattern. (H) Results of the postoperative pathology test (hematoxylin and eosin staining, ×200). The tumor tissue showed a papillary and mesh-like alignment. Tumor cells were cubic and of a column-like shape, with big, atypical and deeply stained nuclei, which infiltrated into the superficial muscle layer of the intestinal wall. The patient was diagnosed with moderately differentiated rectal adenocarcinoma. DCE-MRI, dynamic contrast-enhanced magnetic resonance imaging; Ktrans, volume transfer constant from the plasma compartment to the extravascular extracellular space; Kep, rate constant for transfer between extravascular extracellular space and the blood compartment; Ve, volume of extravascular extracellular space per unit volume of tissue; iAUC, initial area under enhancement curve.

