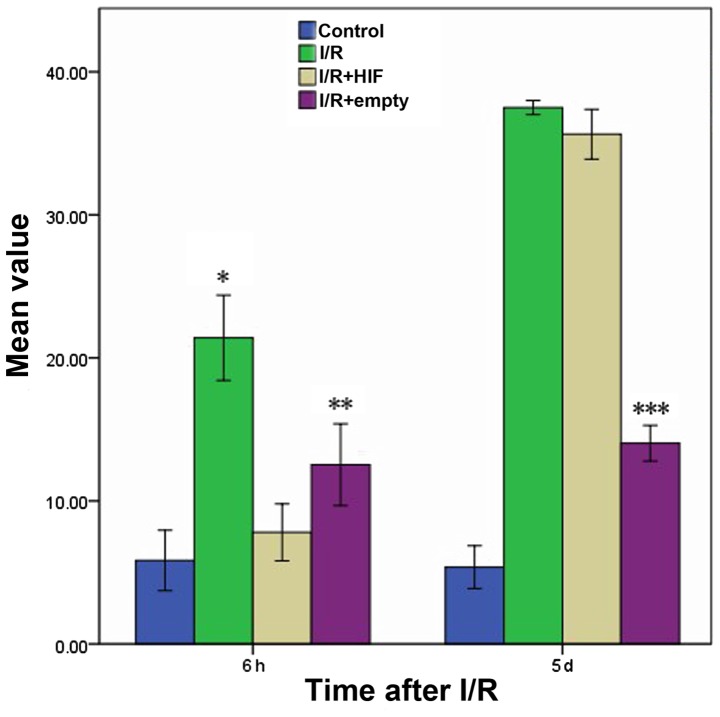
Figure 5.
Rate of apoptosis in myocardial cultures following I/R in the presence or absence of HIF-1α overexpression. Cultures were treated as described in the legend of Fig. 2, and apoptotic cell fractions were determined using fluorescence-activated cell sorting. The bars indicate average values; error bars, the standard deviation (n=3 for each condition). *P<0.05 vs. control; **P>0.05 vs. control; ***P<0.05 vs. 6 h following I/R or mock treatment. I/R, ischemia-reperfusion; HIF-1α, hypoxia-inducible factor-1α.

