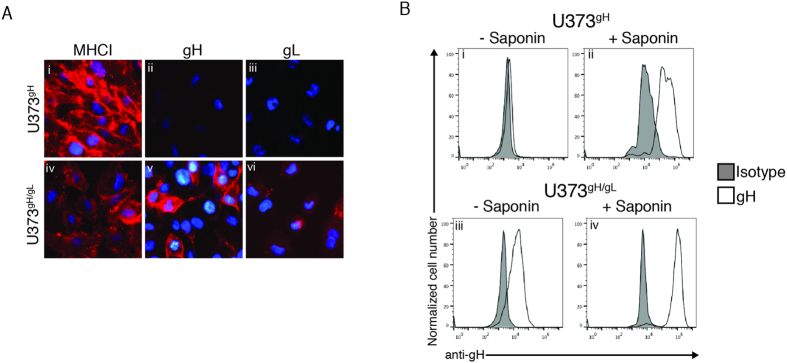
Figure 4. gH/gL dimers traffic to the cell surface.
(A) U373gH and U373gH/gL cell lines were subjected to analysis by fluorescence microscopy. Cells were probed for properly-folded MHC class I (i and iv), gH (ii and v), or gL (iii and vi) with the respective antibodies followed by incubation with an IgG-specific Alexa-555 fluorescent antibody. Hoechst reagent allowed visualization of the nucleus. (B) U373gH and U373gH/gL cell lines were analyzed by flow cytometry for gH expression either without (i and iii), or with (ii and iv) cell permeabilization with saponin treatment. Background fluorescence levels were established by staining with an IgG isotype control.

