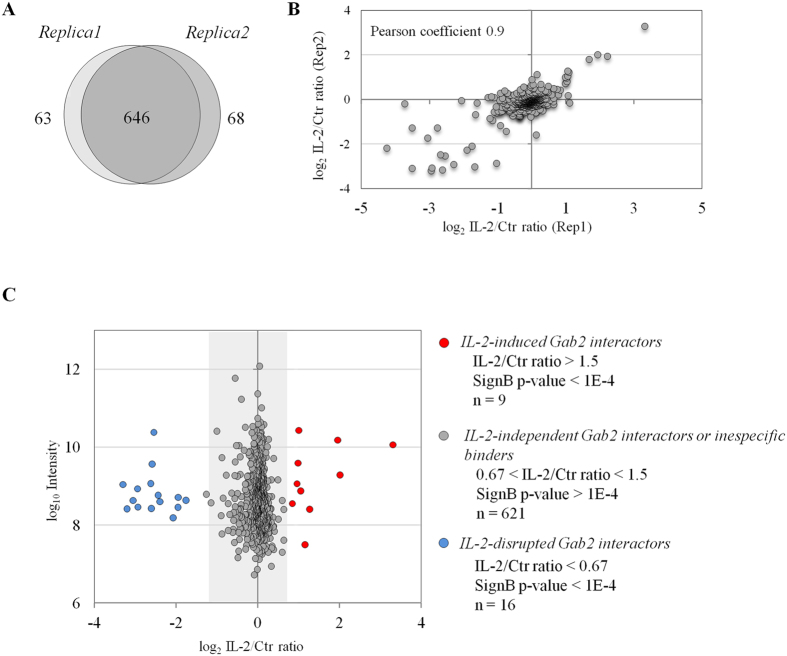
Figure 5. Interactome of Gab2 in Kit225 T-cells.
(A) Venn diagram showing the overlap in proteins co-immunoprecipitating with Gab2 in the two biological replicates performed. (B) Correlation between IL-2/Ctr SILAC ratios obtained in the two replicates analyzed. (C) Combined IL-2/Ctr SILAC ratio corresponding to all the proteins quantified in the two biological replicas of each Gab2 immunoprecipitation is represented as a function of protein intensity in the MS. Dots coloured in red represent proteins that are consistently enriched (IL-2/Ctr > 1.5; Significance B p-value < 0.0001). (D) Heat map and hierarchical clustering dendrogram indicating the IL-2/Ctr SILAC ratio measured in each replicate of the proteins associating with Gab2 upon IL-2 stimulation.

