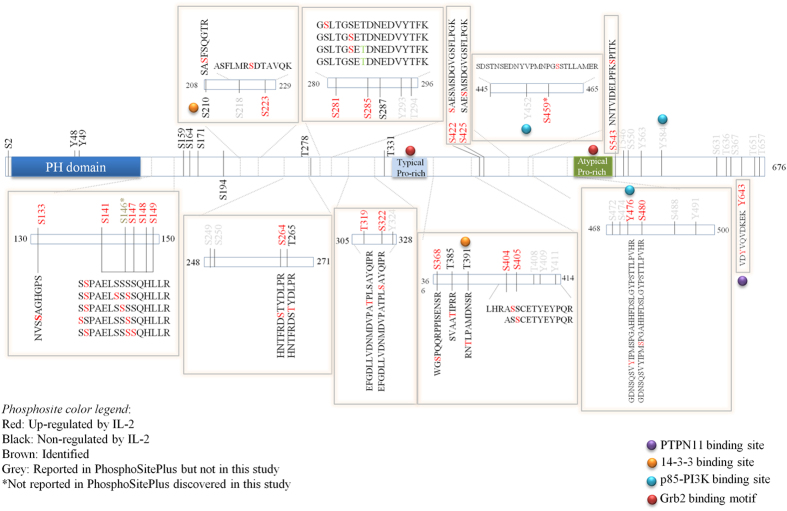
Figure 7. Gab2 phosphomap in IL-2-treated Kit225 T-lymphocytes.
Schematic representation of Gab2 structure indicating motifs, phosphosites and protein binding sites. IL-2-dependent and –independent phosphosites reported in this study are highlighted in red and black, respectively. *indicates that the phosphosite is not reported in PhosphoSitePlus database.

