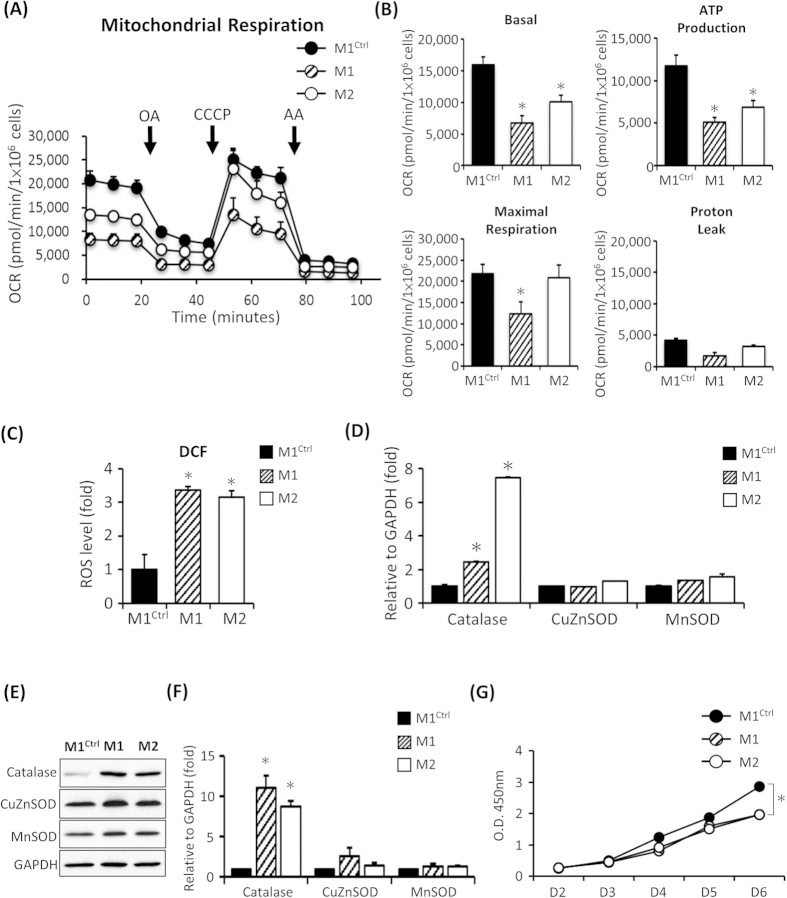
Figure 2. Impaired mitochondrial functions and accumulation of endogenous ROS in MERRF-specific hiPSCs harboring mtDNA A8344G.
(A) Representative data showing the oxygen consumption rate (OCR) in M1, M2 and M1Ctrl hiPSC sublines. (B) Quantitative data of basal oxygen consumption, ATP production, maximal respiration and proton leak. Data are the mean ± SEM, n = 3. (C) Intracellular ROS production of hiPSC as indicated by DCFH-dA staining; fluorescence intensity was measured by flow cytometry. The intensity of the M1ctrl line was defined as 100%. Data are the mean ± SEM, n = 3. (D) qPCR demonstrating the expression level of antioxidant-associated enzymes. Data are the mean ± SEM, n = 3 (E) Western blot indicated the antioxidant enzymes expression. (F) The data represented mean ± SEM of (E), n = 3. (G) Cell proliferation rate of hiPSC sublines. Cell proliferation was determined based on the CCK-8 kit. M1 and M2, MERRF induced pluripotent stem cells. M1Ctrl, MERRF induced pluripotent stem cells carrying normal mtDNA (A8344G free subline).

