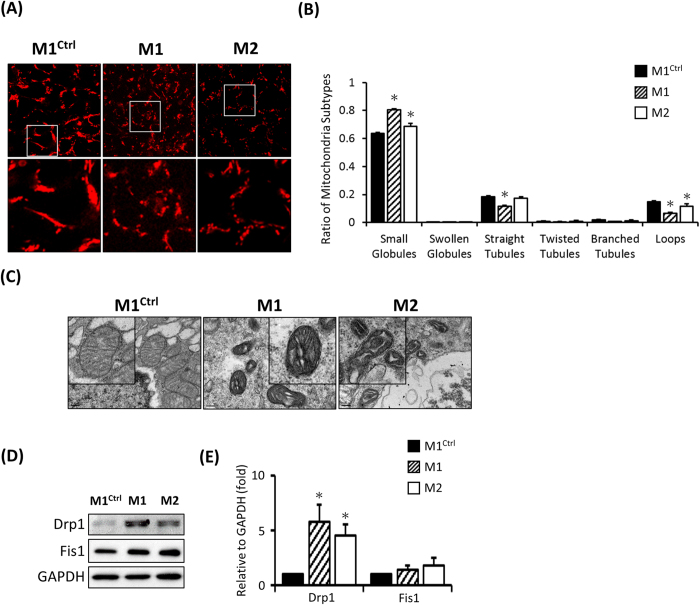
Figure 3. Detection of mitochondrial distribution and morphology in MERRF hiPSCs.
(A) Mitochondrial distribution stained by MitoTracker Red and analyzed by confocal microscopy. (B) Quantitative data revealing mitochondrial subtypes based on a microP analysis. (C) Ultra-structure of hiPSC-M1, hiPSC-M2 and hiPS-M1Ctrl by TEM. (D) Western blot showing the expression of mitochondrial fission proteins. (E) Quantitative result of mitochondrial fission proteins, the data represented mean ± SEM of (D), n = 3. M1 and M2, MERRF induced pluripotent stem cells. M1Ctrl, MERRF induced pluripotent stem cells carrying normal mtDNA (A8344G free subline).

