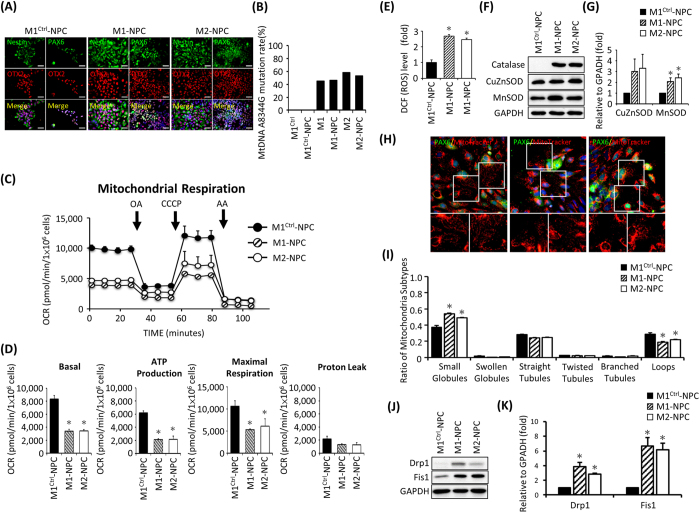
Figure 7. Oxygen consumption of mitochondria as detected with an extracellular flux assay and accumulation of endogenous ROS and altered antioxidant enzyme expression in hiPSC-derived neural progenitor cells.
(A) Immunofluorescence of MERRF hiPSC-NPCs stained with neural markers Nestin, PAX6 and OTX2. Nuclei were counterstained with Hoechst 33342 (blue). Scale bar = 50 μm. (B) mtDNA A8344G mutation rate quantified by pyrosequencing of MERRF hiPSCs and MERRF hiPSC-derived neural progenitor cells. (C) Representative data showing the OCR of hiPSC-M1-, M2- and M1Ctrl-derived NPC. (D) Total basal oxygen consumption, ATP production, maximal respiration and proton leak data. Data are the mean ± SEM, n = 3. (E) Intracellular ROS production of MERRF-hiPS-derived NPC was stained using DCFH-dA. The staining of M1Ctrl-NPC was defined as 100%. Data are the mean ± SEM, n = 3. (F) Western blot showing the expression of antioxidant proteins. (G) Quantitative result of antioxidant proteins. The data represented mean ± SEM, n = 3. (H) MitoTracker Red stained the mitochondria of MERRF hiPSC-NPCs. PAX6 served as a neural marker. (I) Quantitative data showing mitochondrial subtypes based on a microP analysis. (J) Western blot showing the expression of mitochondrial fission proteins. (K) Quantitative result fission proteins. The data represented mean ± SEM, n = 3. M1-NPC and M2-NPC, MERRF hiPSC-derived neural progenitor cells carried mtDNA A8344G mutation. M1ctrl-NPC, hiPSC-derived neural progenitor cells carried normal mtDNA.

