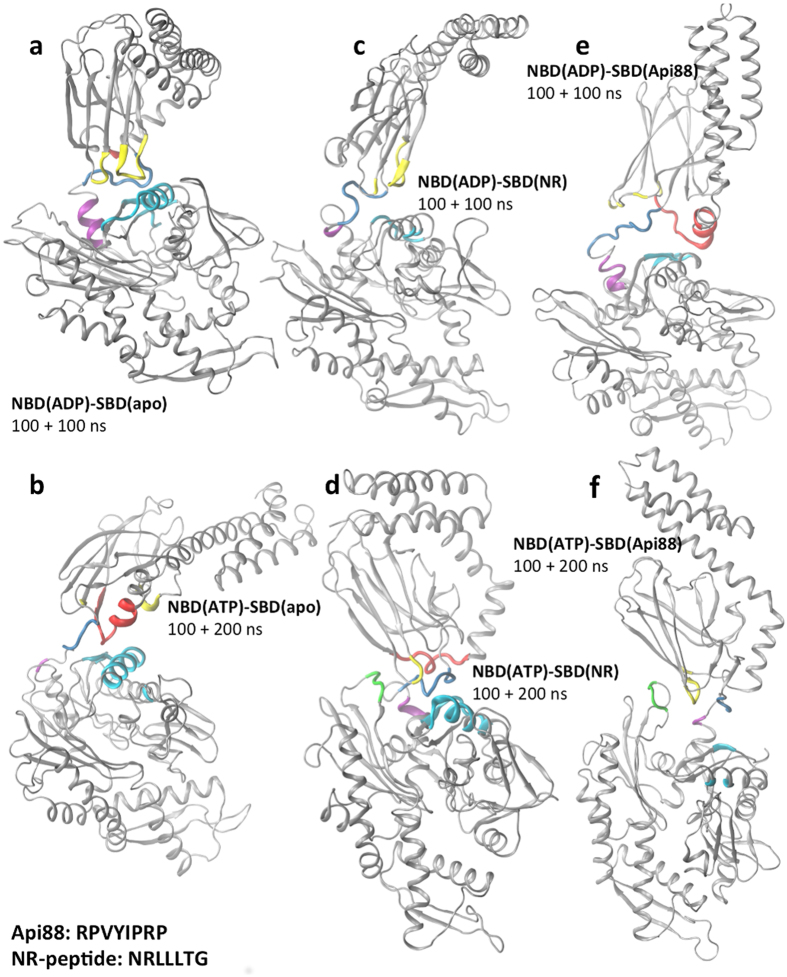
Figure 2. Contact interface.
Representative conformation of the most populated cluster for each complex is displayed: (a) NBD(ADP)-SBD(free); (b) NBD(ATP)-SBD(free); (c) NBD(ADP)-SBD(NR); (d) NBD(ATP)-SBD(NR); (e) NBD(ADP)-SBD(Api88); (f) NBD(ATP)-SBD(Api88). Regions that correspond to the contacting interfaces between NBD and SBD along the trajectories (see Methods) shown in the colour of the subdomain they belong to (see legend Fig. 1).

