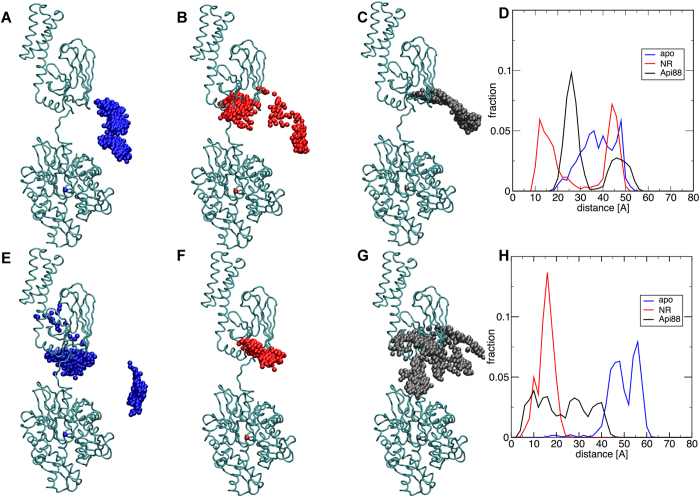
Figure 3. Distribution of the SBD centre of mass along the MD trajectories, after aligning the protein to the NBD.
Top, cloud showing the distribution of SBD centre of mass coordinates relative to the starting conformation for ADP bound systems: (A) SBD(free), (B) SBD(NR), (C) SBD(Api88). Bottom, same for ATP bound systems: (E) SBD(free), (F) SBD(NR), (G) SBD(Api88). (D) Distribution of distances from the starting position of the SBD centre of mass for ADP bound systems, obtained after merging the two independent runs for each system (blue: SBD(free), red SBD(NR), black SBD(Api88). (H) Same for ATP bound systems.

