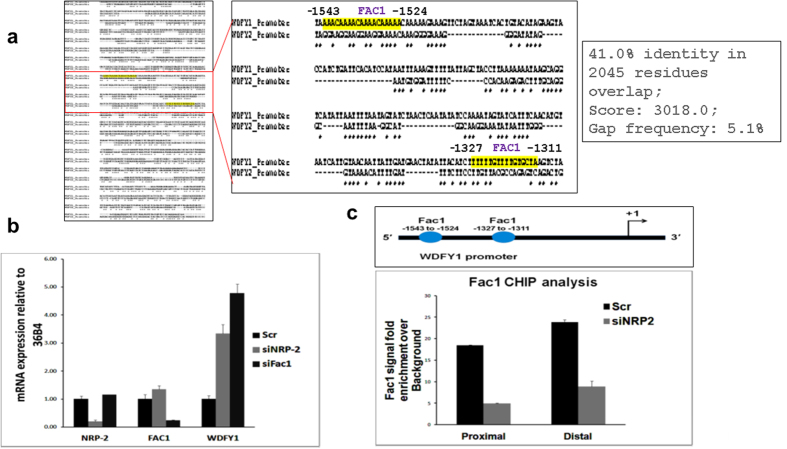
Figure 5. Fac1 controls WDFY1 transcription.
(a) Comparing the promoter sequence of WDFY1 and WDFY2. The red boxed region was amplified and the magnified image shown in right. The yellow highlighted region indicates the FAC1 binding sites in WDFY1 promoter. (b) Quantification of relative expression of WDFY1 mRNA using RT-PCR following the depletion of NRP2 and FAC1. (c) CHIP analysis showing the recruitment of FAC1 to the WDFY1 promoter region following depletion of NRP2. Data are represented as a change in signal intensities over the background. Rabbit IgG was used as an internal control.

