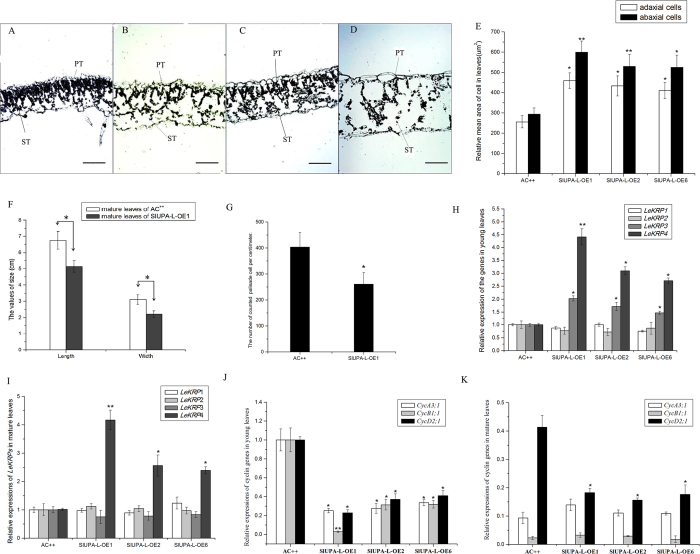
Figure 2. Cell enlargement induced by SlUPA-like and expression analysis of LeKRPs and cycle related genes in leaves of transgenic lines and control.
Light micrographs of cross sections of young leaves of AC++ (A), young leaves of SlUPA-L-OE plants (B), mature leaves of AC++ (C), and mature leaves of SlUPA-L-OE plants (D), magnification, 80×. PT, palisade tissue; ST, spongy tissue. (E).The relative average area of adaxial and abaxial cells from control and SlUPA-L-OE leaves were calculated. (F). Statistical analysis of length and width of the first leaflets. (G). Calculated number of palisade cell per centimeter from the first leaflets. Expression analysis of LeKRPs both in young leaves (H) and mature leaves (I). Expression analysis of cell cycle related genes both in young leaves (J) and mature leaves (K). Each value represents the mean ± SD of three replicates. Asterisks indicate a significant difference (**P < 0.01 and *P < 0.05) between WT and transgenic lines.

