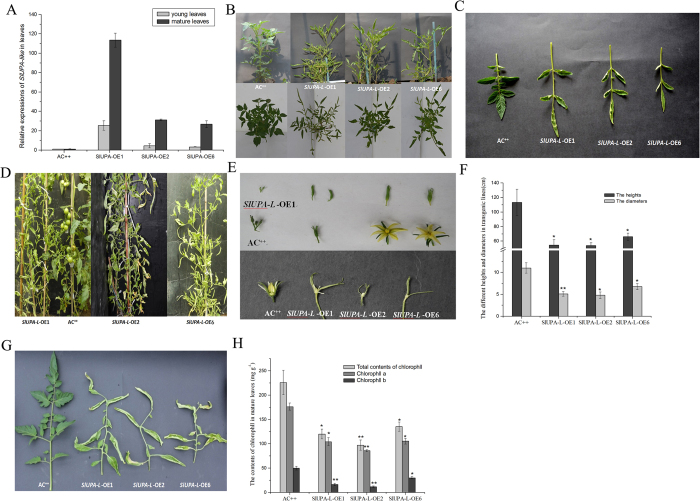
Figure 3. The aberrant developments showed in SlUPA-L-OE plants.
(A). Expression analysis of SlUPA-like in young and mature leaves. The phenotypes of young plants (B), young leaves (C), and adult plants (D). (E). The flowers of transgenic plants (the top half of this picture) and opened flowers artificially (the bottom half of this picture). (F). The mean height and diameter in adult plants. The phenotypes (G) and chlorophyll content (H) of mature leaves of transgenic lines and wild type. Each value represents the mean ± SD of six replicates. Asterisks indicate a significant difference (**P < 0.01 and *P < 0.05) between WT and transgenic lines.

