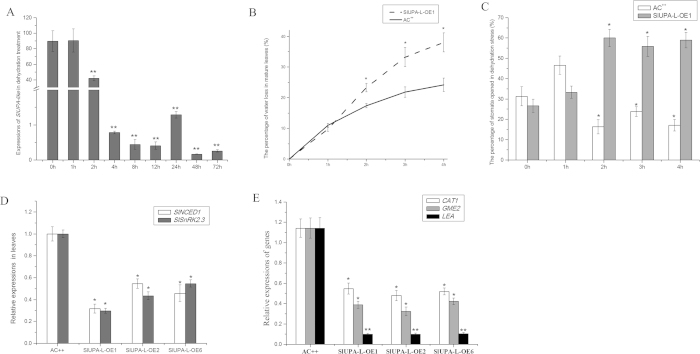
Figure 7. The dehydration treatments and related stomatal behavior in plants.
(A). Expression analysis of SlUPA-like under dehydration stress. The percent of water loss (B) and the percentage of opened stomata in mature leaves (C) of control and SlUPA-L-OE1 under dehydration stress. Expression analysis of ABA signal transduction (D) and responsive genes in mature leaves. Each value represents the mean ± SD of three replicates. Asterisks indicate a significant difference (**P < 0.01 and *P < 0.05) between WT and transgenic lines.

