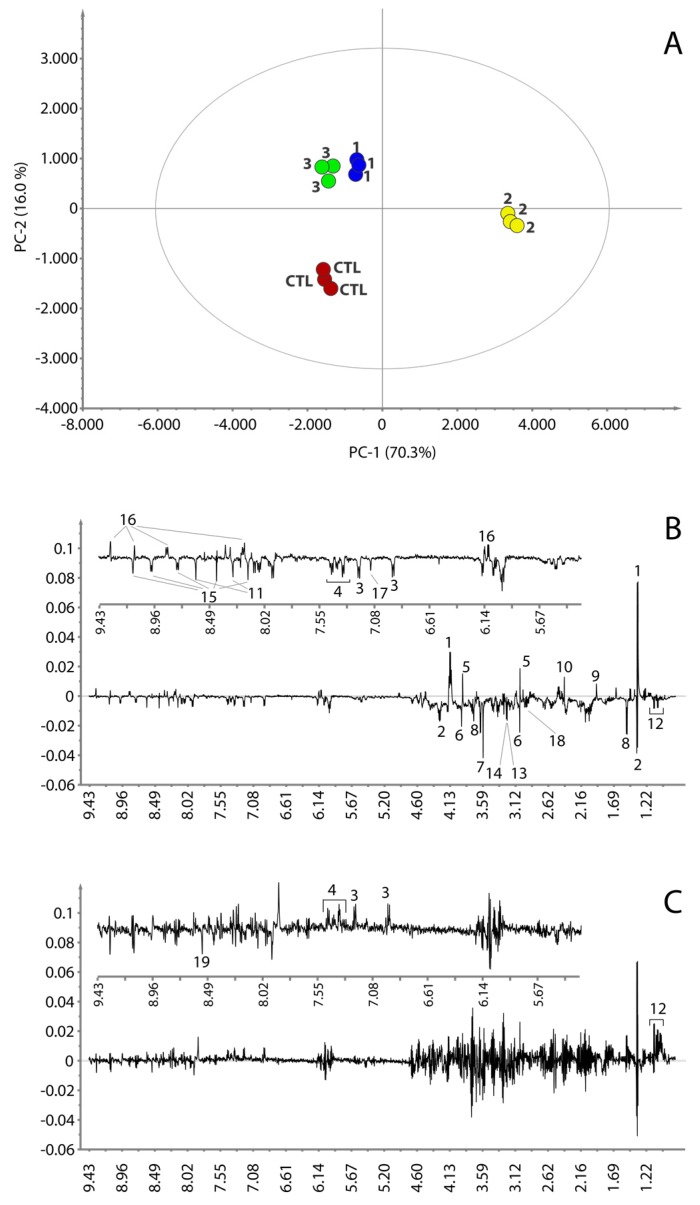
Figure 4.
PCA score plot (A). PC-1 and PC-2 loading plots are reported in panel (B,C), respectively. Insets in (B,C) are expanded regions of the relative loading plots. Control samples are colored in red; compound 1, 2 and 3 in blue, dark yellow and green, respectively. Numbers on the loading plots refer to the NMR assignment reported in Figure 3.

