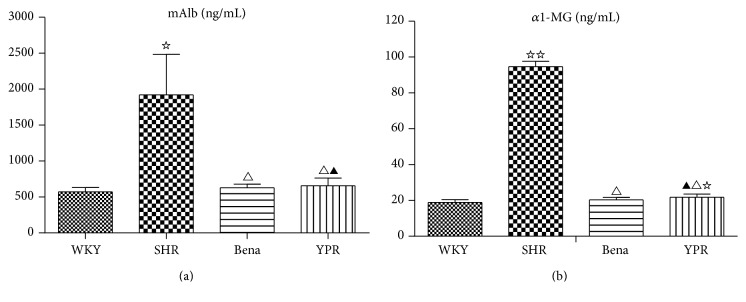
Figure 1.
Influence of YPR on urine mAIb (a) and α1-MG (b) (n = 7). (a) Compared with the WKY group ☆ P < 0.01; compared with the SHR group △ P < 0.01; compared with the Bena group ▲ P > 0.05. (b) Compared with the WKY group ☆☆ P < 0.01, ☆ P < 0.05; compared with the SHR group △ P < 0.01; compared with the Bena group ▲ P > 0.05.

