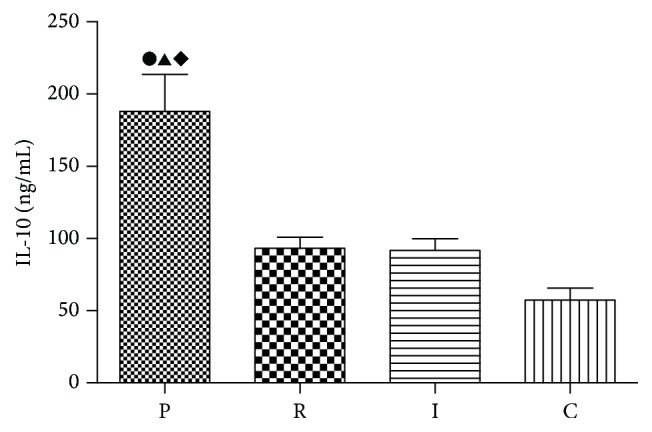
Figure 7.

Quantitative assays for protein levels of IL-10 in the BAL fluid. PAO1 group (P), ΔlasIΔrhlI group (I), ΔlasRΔrhlR group (R), and control group (C). ●: compared with control group, p < 0.05. ▲: statistically significant differences between PAO1 and ΔlasRΔrhlR group, p < 0.05. ◆: statistically significant differences between PAO1 and ΔlasIΔrhlI group, p < 0.05.
