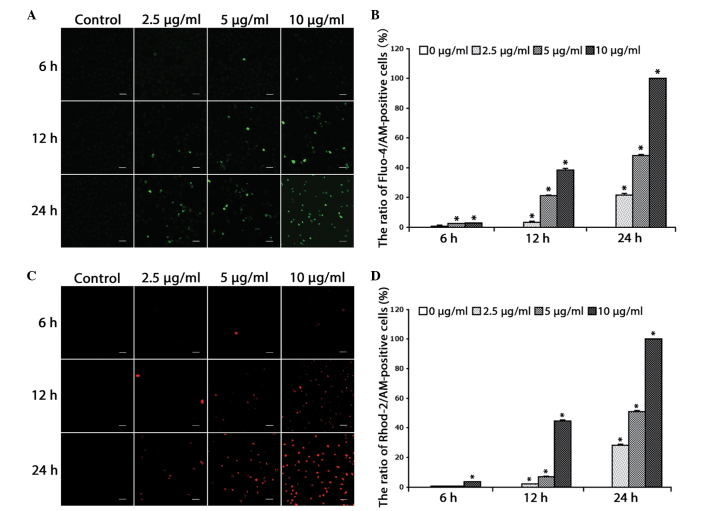
Figure 1.
Cisplatin increases free Ca2+ levels in the cytosol and mitochondria. (A) The cells were treated with cisplatin (2.5, 5 or 10 µg/ml) for 0, 6, 12 and 24 h, and incubated with the fluorescent calcium indicator, Fluo-4/AM. Calcium concentrations in the cytosol were observed by confocal microscopy (scale bar, 40 µm). (B) Quantitation of free Ca2+ levels in the cytosol. Data are presented as the mean ± SD (n=3). *P<0.05 vs. control. (C) Cells were treated with cisplatin (2.5, 5 or 10 µg/ml) for 0, 6, 12 and 24 h, and incubated with the fluorescent calcium indicator, Rhod-2. Calcium concentrations in the mitochondria were observed by confocal microscopy (scale bar, 40 µm). (D) Quantitation of free Ca2+ levels in the mitochondria. Data are presented as the mean ± SD (n=3). *P<0.05 vs. control. SD, standard deviation.

