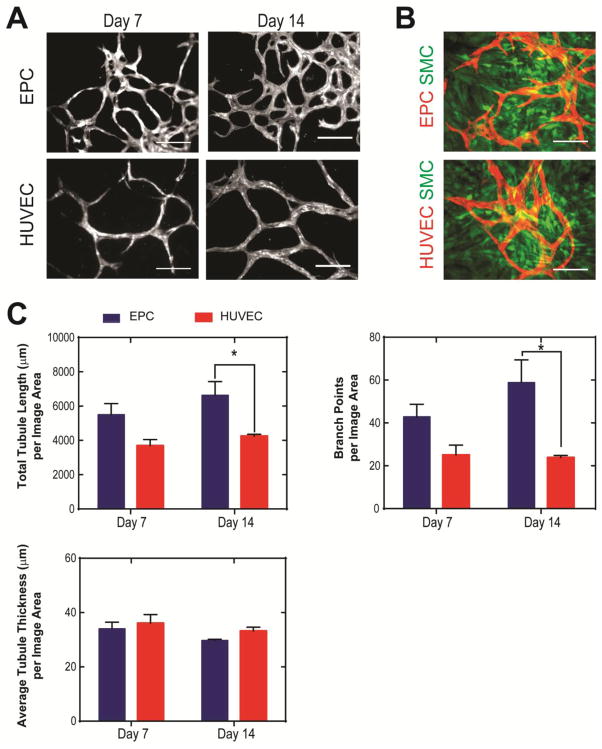
Figure 3. Comparison of network formation by hCB-EPCs and HUVECs upon co-culture with mural cells.
(A) Representative images of network formation by fluorescent protein-transduced hCB-EPCs (EPCs) and HUVECs in co-culture with SMCs (not visible) at 7 and 14 days after plating tissue-culture treated glass. Scale bar = 200 μm. (B) Representative images of SMCs (green) in co-culture with hCB-EPCs and HUVECs (red) after 14 days of culture. Scale bar = 200 μm. (C) Quantitative analysis of EPC and HUVEC network morphology during the first 14 days of culture assessed through total tubule length, branch points, and average tubule thickness. * indicates significant difference, p < 0.05. n=5–6 images analyzed per condition from 2 separate experiments. Image area analyzed is 0.57 mm2 per image.

