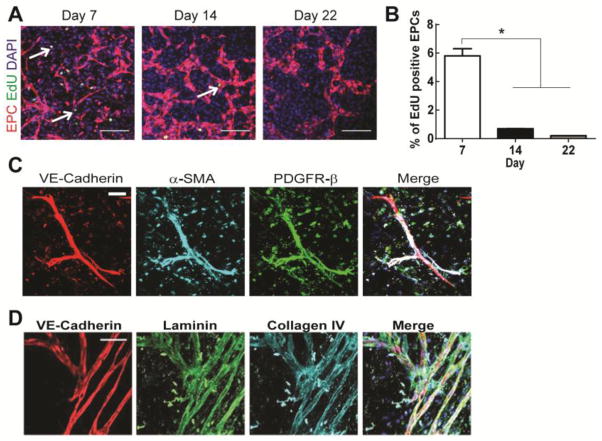
Figure 6. hCB-EPCs in microvessels arrest proliferation by 2 weeks of co-culture with SMCs, contain pericyte investment and basement membrane.
(A) Representative images of EdU assay analysis on during the first 22 days of hCB-EPC microvessel formation. EdU (green, indicated by white arrows) was incorporated into the DNA of cells and distinguished between cell types with tomato fluorescent protein-transduced hCB-EPCs in co-culture with SMCs (not visible). Nuclei are indicated through DAPI (blue). Scale bar equals 200 μm. (B) Quantitative results for hCB-EPC proliferation from the EdU assay. * indicates p <0.05. n=3 images analyzed per time point. (C) Representative images of hCB-EPC microvessels, after 14 days of co-culture with SMCs, immunostained for pericyte investment based upon expression of α-SMA (cyan), PDGFR-β (green) adjacent to microvessel structures (VE-cadherin, red). Nuclei are indicated with DAPI. Scale bar equals 50 μm. (D) Representative images of hCB-EPC microvessels, after 14 days of co-culture with SMCs, immunostained for the presence of basement membrane based upon expression of laminin (green) and collagen IV (cyan) protein deposition adjacent to microvessel structures (VE-cadherin, red). Nuclei are indicated with DAPI. Scale bar equals 100 μm.

