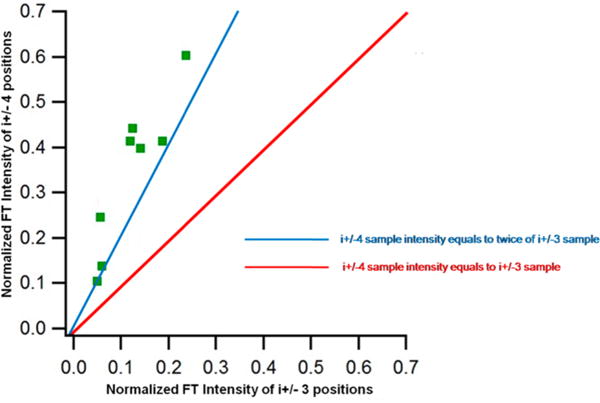
Figure 4.

Frequency domain 2H peak intensity comparison between i ± 4 positions and i ± 3 positions for all ESEEM data. Red line represents that the ESEEM 2H FT peak intensity of the i ± 4 is equal to the corresponding i ± 3 sample. Blue line represents that the ESEEM 2H FT peak intensity of the i ± 4 sample is as twice that of the corresponding i ± 3 sample.
