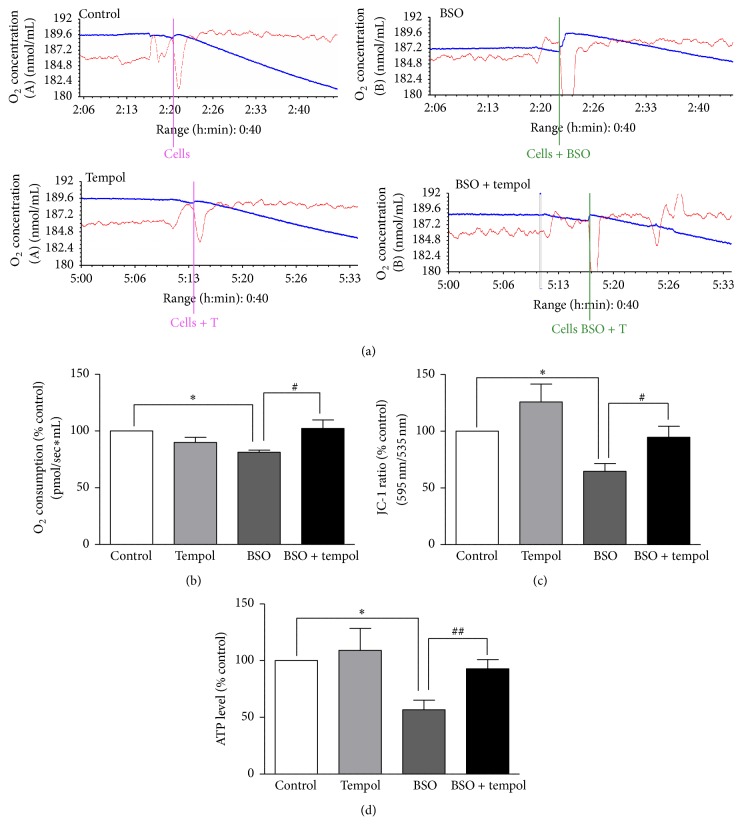
Figure 3.
Analysis of mitochondrial oxygen consumption, mitochondrial membrane potential, and ATP levels in HT22 cells. (a) Representative oxygraphs showing respiratory activity of the HT22 cells. (b) The measurements were performed with 7.5 × 10⁵ cells per assay. The rate of oxygen consumption is shown in pMO2/mL and represented as % control (n = 4), (c) mitochondrial membrane potential data presented as a ratio of J-aggregates intensity (595 nm) to monomer intensity (535 nm). The JC-1 ratio was calculated as % control (n = 8). (d) ATP levels of the cells were evaluated using the luciferase assay system. Data is represented as % control (n = 8). ∗ p < 0.05 significantly different from control; # p < 0.05, ## p < 0.01 significantly different from BSO. Bars represent means ± SEM.

