
Figure 4.
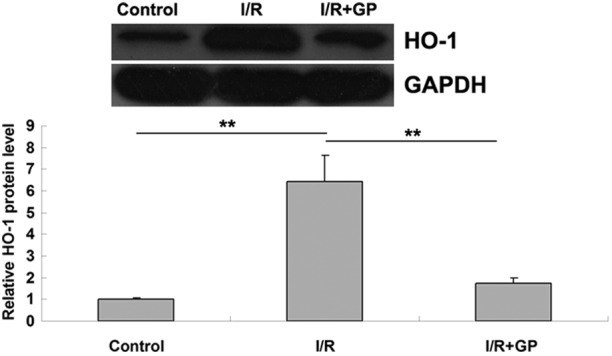
Protein expression levels of HO-1 in renal tissue. Data are presented as the mean ± standard error. **P<0.01, comparisons shown by brackets. GAPDH was used as an internal control. HO-1, heme oxygenase-1; I/R, saline-treated ischemia/reperfusion group; I/R+GP, geniposide-treated ischemia/reperfusion group.