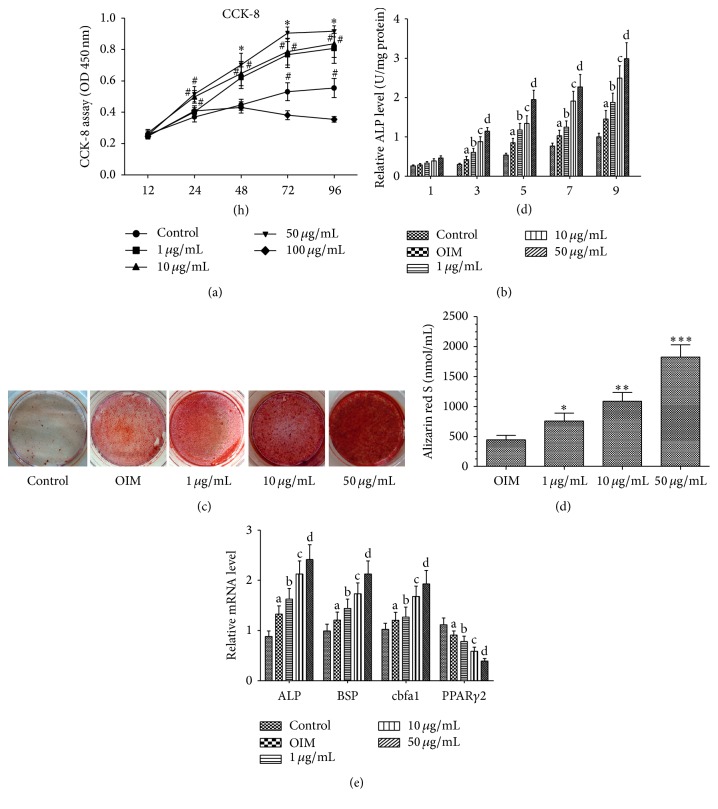
Figure 1.
Naringin potentiates proliferation and osteogenic differentiation of BMSCs. (a) BMSCs were cultured in basal medium with or without various doses of naringin (1, 10, 50, and 100 μg/mL) for 12–96 hours, and the proliferation rate was assessed by CCK-8 assay. Cell proliferation of BMSCs was enhanced by naringin treatment. Naringin showed the most prominent stimulatory effect on proliferation at 50 μg/mL. Data is expressed as mean ± SD. Experiments were done in quadruplicate (n = 4). ∗ P < 0.01 versus the control group; # P < 0.05 versus the control group at same time point. (b) BMSCs were cultured in basal medium with or without various doses of naringin (1, 10, 50, and 100 μg/mL) for 1, 3, 5, 7, and 9 days. Data represent the mean ± SD (n = 4). ALP activity was measured by the manufacturer's instructions. a P < 0.05 versus the control group at the same time point; b P < 0.01 versus the OIM group at the same time point; c P < 0.05 versus the 1 μg/mL group at the same time point; d P < 0.01 versus the 10 μg/mL group at the same time point. (c) BMSCs were cultured in basal medium and OIM with or without various doses of naringin (1, 10, and 50 μg/mL) for 21 days; then calcium deposits were stained with Alizarin red S solution. For quantitative analysis, the stained samples underwent cetylpyridinium chloride (CPC) extraction (10% CPC) and extracts were measured by spectrophotometry. Data represent the mean ± SD (n = 5). ∗ P < 0.01 versus the OIM group; ∗∗ P < 0.05 versus the 1 μg/mL group; ∗∗∗ P < 0.01 versus the 10 μg/mL group. (e) BMSCs were cultured in basal medium, OIM, or OIM with 1 μg/mL, 10 μg/mL, or 50 μg/mL naringin for 14 days, and then ALP, BSP, Cbfa1, and PPARγ2 mRNA levels were measured by RT-PCR. Data represent the mean ± SD (n = 5). a P < 0.05 versus the control group; b P < 0.05 versus the OIM group; c P < 0.01 versus the 1 μg/mL group; d P < 0.01 versus the 10 μg/mL group.

