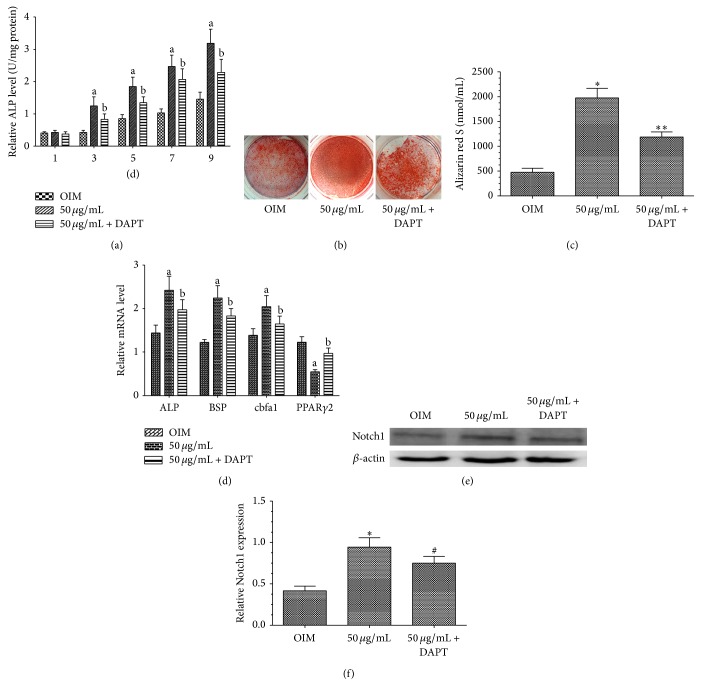
Figure 2.
Involvement of Notch signaling in naringin-enhanced osteogenesis of BMSCs. (a) Effects of naringin on ALP activity of BMSCs cultured in OIM or OIM containing 50 μg/mL naringin with or without 10 μM DAPT, for 1–9 days. Data represent the mean ± SD (n = 4). a P < 0.01 versus the OIM group; b P < 0.01 versus the 50 μg/mL naringin group at the same time point. (b) Alizarin red S staining shows that DAPT inhibited naringin-enhanced mineralization of BMSCs. (c) Quantification and statistical analysis of calcium deposits. Data represent the mean ± SD (n = 5). ∗ P < 0.01 versus the OIM group; ∗∗ P < 0.01 versus the 50 μg/mL group. (d) BMSCs were cultured in OIM or OIM containing 50 μg/mL naringin with or without 10 μM DAPT, for 14 days. Expression levels of osteogenesis-related genes and PPARγ2 were measured by RT-PCR. Data represent the mean ± SD (n = 5). a P < 0.01 versus the OIM group; b P < 0.05 versus the 50 μg/mL group. (e) Western blot analysis of Notch1. BMSCs were cultured in OIM or OIM containing 50 μg/mL naringin with or without 10 μM DAPT for 14 days. (f) Band density in the western blots was quantified by densitometry. Data represent the mean ± SD (n = 4). ∗ P < 0.01 versus the OIM group; # P < 0.05 versus the 50 μg/mL naringin group.

