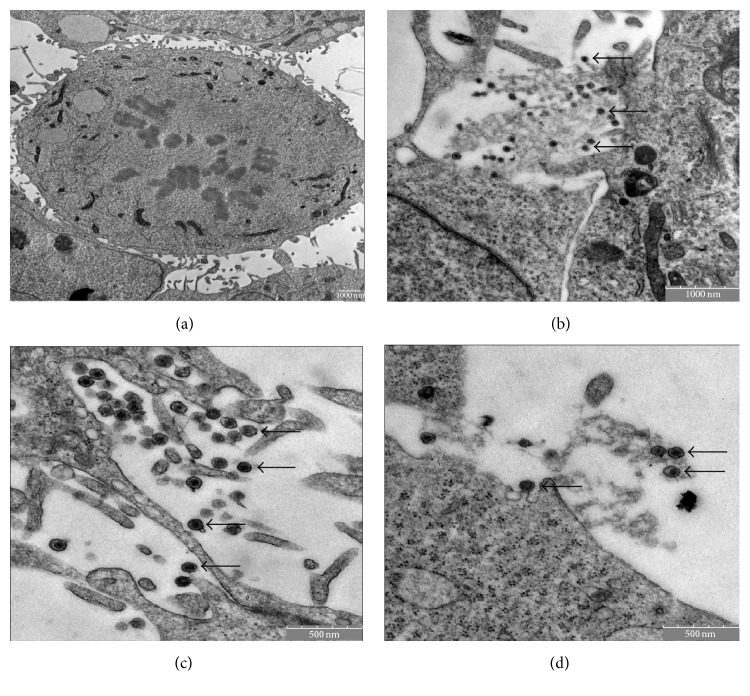
Figure 1.
Visualization of synovial sarcoma cells and microvesicles by transmission electron microscopy (TEM). (a) Synovial sarcoma cell. Bar indicating 1000 nm. ((b)–(d)) Close-up view which shows the release of microvesicles (arrows) by the synovial sarcoma cell. Bars indicating 1000 nm (b) and 500 nm ((c) and (d)).

