Figure 3.
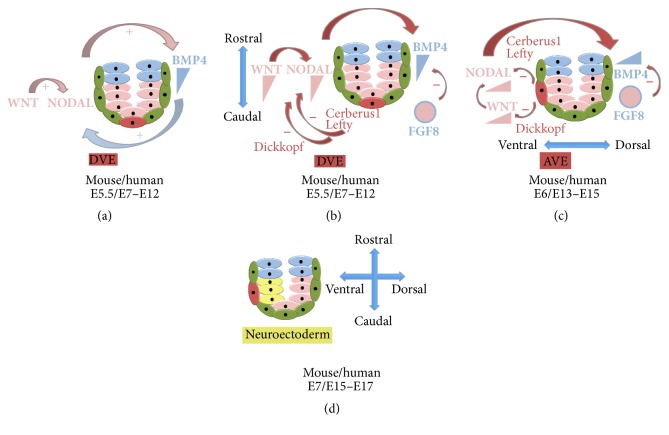
Molecular pathways in neural induction. (a) The epiblast (depicted in pink) expresses Nodal. The epiblast through Nodal stimulates (pink arrow) the expression of BMP4 (depicted in blue) in the extraembryonic ectoderm (blue cells). The extraembryonic ectoderm, by the action of BMP4, stimulates (blue arrow) the WNT (depicted in pink) pathway in the epiblast that in turn further activates (pink arrow) Nodal expression. Thus, there is a positive feedback loop between Nodal, BMP, and WNT. Colour scheme: arrows corresponds to the related tissue/morphogen. (b) The DVE (depicted in red) expresses Cerberus1 and Lefty (also depicted in red) to inhibit Nodal expression, therefore downregulating Nodal in its proximity. It also expresses Dickkopf (depicted in red), a protein that inhibits WNT3 signals close to the DVE. Downregulating Nodal and WNT also inhibits BMP4 expression close to the DVE. Thus, there is a gradient of Nodal, WNT, and BMP with a high expression rostrally and low expression caudally. FGF8 (pink and blue), expressed both in the epiblast (pink) and extraembryonic ectoderm (blue), also inhibits BMP4 contributing to the gradient. Colour scheme: arrows corresponds to the secreted inhibitory molecules/tissue source (DVE). They show the consequence of the negative feedback that creates the morphogen gradients in the R-C axis. (c) The DVE migrates into the AVE and the gradients are thus remodelled with low Nodal, WNT, and BMP expression ventrally and high dorsally. (d) Due to these gradients the neuroectoderm is formed at the ventral pole of the epiblast. Colour scheme: arrows corresponds to the secreted inhibitory molecules/tissue source (AVE). They show the consequence of the negative feedback that creates the morphogen gradients in the D-V axis. All timelines are given for mouse and human embryonic development.

