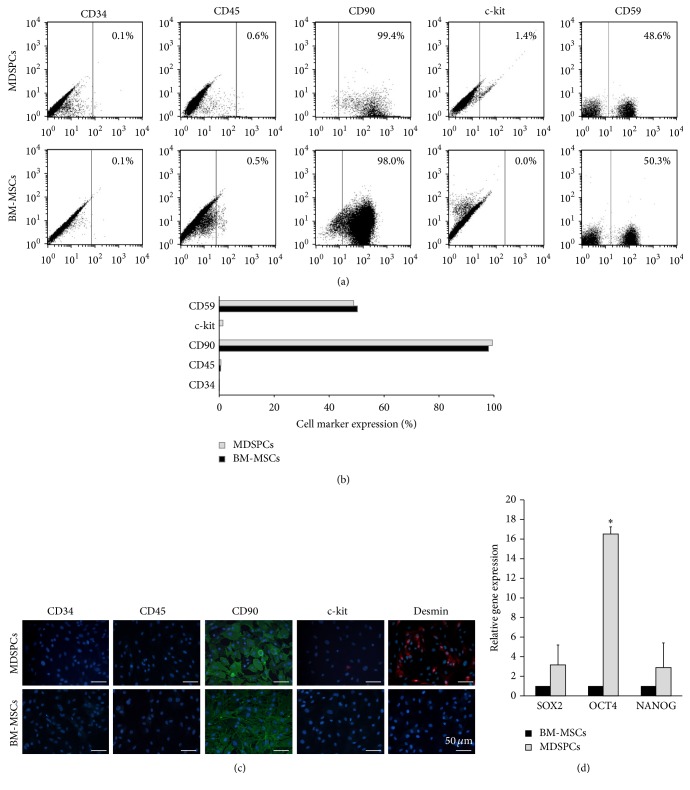
Figure 3.
Surface marker and gene expression analysis of MDSPCs and BM-MSCs at passages 4-5. Surface marker expression was determined by the flow cytometry ((a), (b)) and immunofluorescence staining (c). BM-MSCs and MDSPCs highly expressed CD90 and CD59 and were negative (<1%) for CD45 and CD34. MDSPCs were positive for desmin and weakly positive for c-kit (CD117), while BM-MSCs were negative for both of these markers. (d) MDSPCs had higher expression of SOX2, OCT4, and NANOG, but the significant difference was detected only in OCT4 expression (p = 0.037). ∗ p < 0.05, significant difference.

