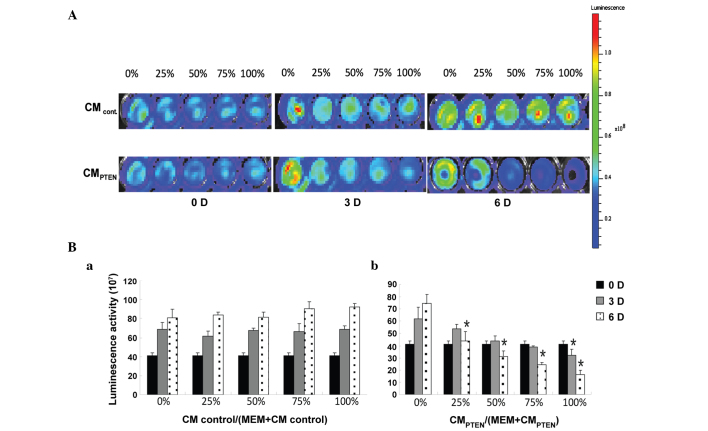
Figure 4.
Assessment of U251 cell viability using bioluminescence determination. (A) Representative measurement of luminescence intensity. Cell culture medium is indicated on the left side of the graph. CM ratios and time points are labeled at the top and bottom of the images respectively. The luminescence intensity of each well was determined by IVIS Spectrum System, 10 min subsequent to adding D-luciferin. Luminescence scale: Color scale: Min = 6.31×10⁶; Max = 1.19×10⁸. (B) Summary of U251 cell viability. U251 cells were co-cultured with (a) CMcontrol and (b) CMPTEN. The relative cell viability is represented as luciferase activity. Data are presented as mean ± standard error of the mean. *P<0.05 vs. control (0%) at the same time point. CM, conditioned media; PTEN, phosphatase and tensin homolog; CMCONTROL, CM collected from the cultures of native MSCs; CMPTEN, CM collected fom the cultures of PTEN-engineered MSCs.

