
Figure EV2. FDR and number of DMRs at different methylation difference theresholds.
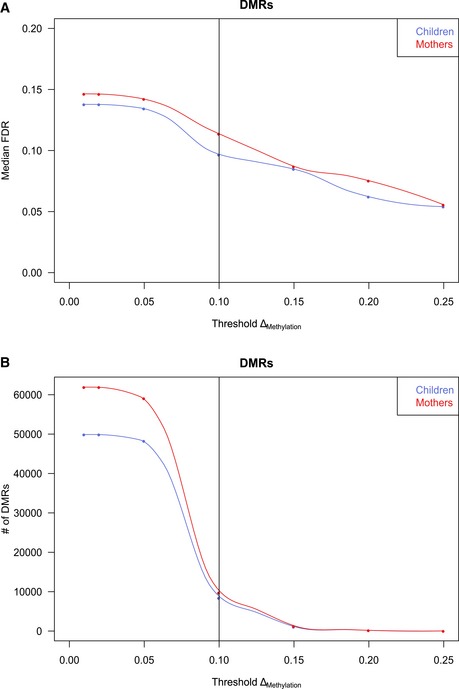
- Median false discovery rate (FDR) estimated by permutation analysis at different cutoffs for mean methylation changes of DMRs (ΔMethylation).
- Number of DMRs after filtering called at different mean methylation changes. The 10% ΔMethylation cutoff is marked and indicates a fair balance between sensitivity and specificity while offering acceptable FDRs (9.7% in children, 11.4% in mothers).