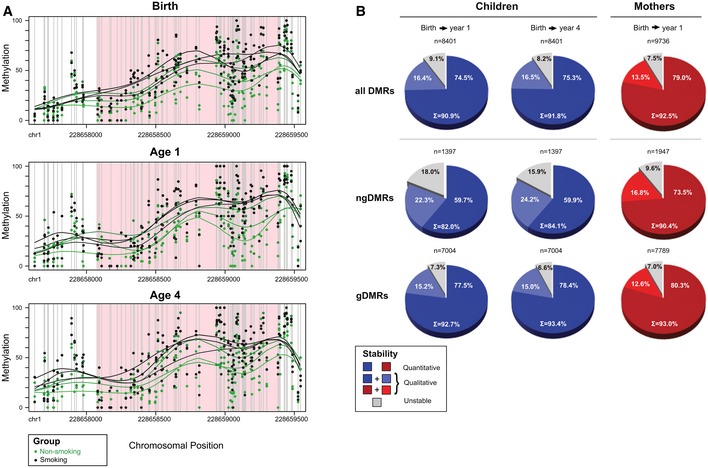
Figure 3. Differentially methylated regions show high stability over time.

- Example of an intergenic ngDMR located 8,965 bp away from the TSS of miR‐466‐6A. Green dots indicate the raw methylation values for non‐smoking samples for all 48 CpGs in the region, while black dots indicate the raw methylation of children from smoking mothers. Lines represent smoothed methylation levels. Methylation differences of 14.5, 13.5, and 12.5%, at time of birth, one year after birth, and four years after birth, respectively, show a strong, quantitative stability of the differential hypermethylation at this locus.
- Global analysis over all DMRs, ngDMRs, and gDMRs (from top to bottom row) in mothers and children shows stability of methylation using both quantitative criteria (decrease in absolute mean methylation difference between smokers and non‐smokers should not exceed 5%) as well as qualitative criteria (direction of differential methylation should remain identical irrespective of the absolute methylation change). As expected, genetically determined gDMRs are more stable than their non‐genetically determined counterparts. Still, 90.4% (82–84.1%) of the ngDMRs show longitudinal stability in mothers (children).
