
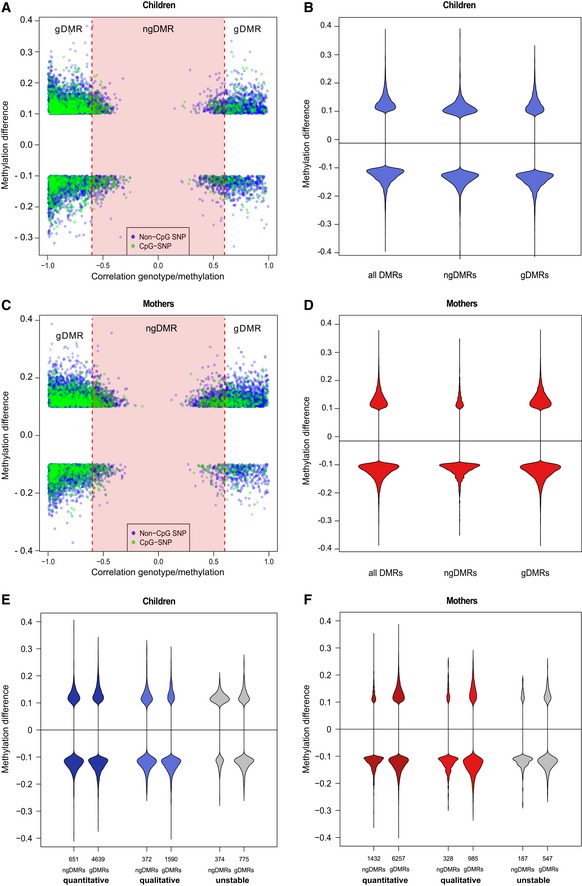
Figure EV3. meQTL distinguish gDMR and ngDMR.
-
A–DEach DMR is associated with its most highly associated SNP within ± 5 kb, and each dot represents a DMR/SNP association. The x‐axis shows the level of correlation between genotype and methylation level, and the y‐axis shows the methylation difference for the DMR between the smoking and non‐smoking group. DMRs associated with a CpG‐destroying SNP are highlighted in green. A gDMR is defined as a DMR, which has an associated neighboring SNP with an absolute correlation above 0.6 (red vertical lines, FDR 10%), and the remaining DMRs are defined as ngDMRs (red shaded area). The effect of the 10% cutoff on the methylation difference is seen in this plot. Violin plots in (B, D) show the methylation difference in all DMRs, ngDMRs, and gDMRs.
-
E, FMethylation differences are shown for the various DMR stability classes, distinguishing ngDMRs (left in violin plot pairs) from gDMRs (right violin plot in each pair).