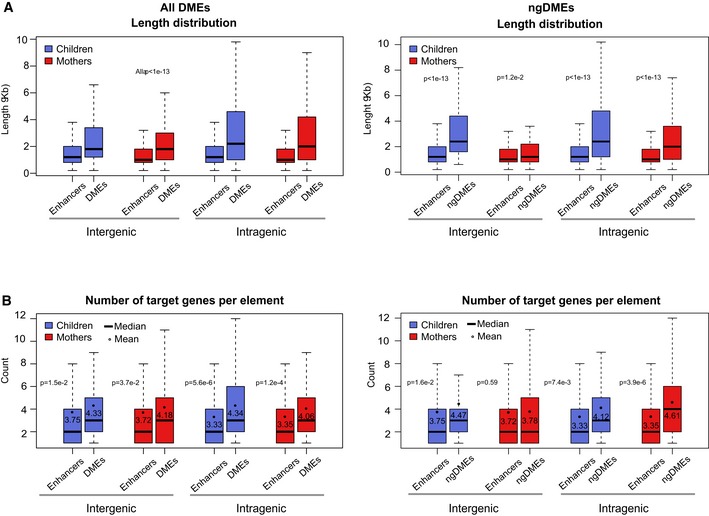
Figure EV5. Differentially methylated enhancers are regulatory hubs.

- Length distribution of enhancers (non‐TSS‐associated active regulatory regions) and ngDMEs in mothers and children, both inter‐ and intragenic, indicating a significant increase in length for differentially methylated enhancers compared to other enhancers.
- Distribution of the number of predicted target genes from the interaction datasets for the same categories as in (A). Black dots indicate the mean number. The corresponding P‐value is indicated (Mann–Whitney test), showing a significant increase for ngDMEs, which is more pronounced in intragenic elements.
Data information: (A, B) Box plots vizualize 25/75 percentile and median, whiskers represent non‐outlier range.
