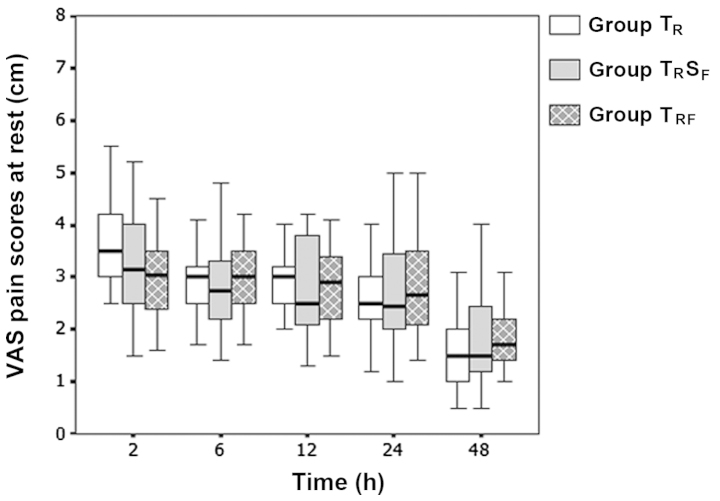
Figure 4.
A box plot of the VAS pain scores at rest for each group in the first 48 h postoperatively. Data are presented as the mean ± standard deviation. Group TR, TAP block with ropivacaine; group TRSF, TAP block with ropivacaine plus subcutaneous fentanyl; group TRF, TAP block with ropivacaine-fentanyl mixture. VAS, visual analog scale; TAP, transversus abdominis plane.

