
Figure 7.
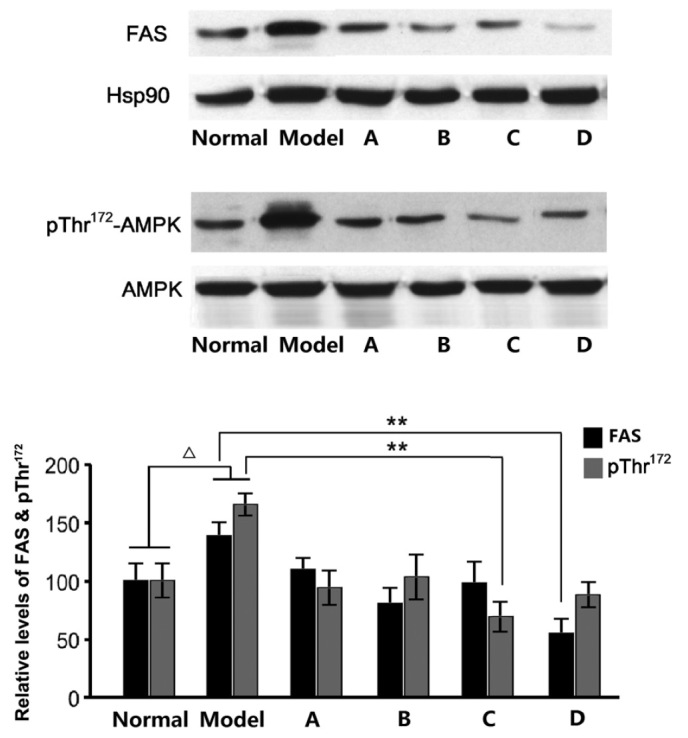
Protein expression levels of FAS, and pThr172-AMPK in the liver. ∆P<0.05 vs. the control group; **P<0.01. Black, FAS; grey, pThr172-AMPK. Hsp90, heat shock protein 90; FAS, fatty acid synthase; pThr172-AMPK, threonine-172 phosphorylated adenosine monophosphate-activated protein kinase; A-D, flavonoid A-D groups.