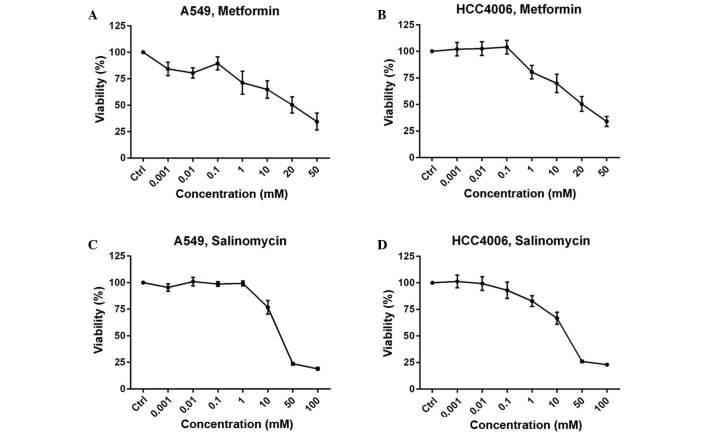
Figure 1.
Dose-response curves of metformin and salinomycin. (A and C) A549 and (B and D) HCC4006 cells were treated with (A and B) metformin or (C and D) salinomycin for 48 h. Metformin was applied in concentrations ≤50 mM and salinomycin in concentrations ≤100 µM. Values were compared to untreated cells (Ctrl). The values of untreated cells were assumed to represent 100% metabolic activity. All points represent the mean value and error bars represent standard error of the mean.

