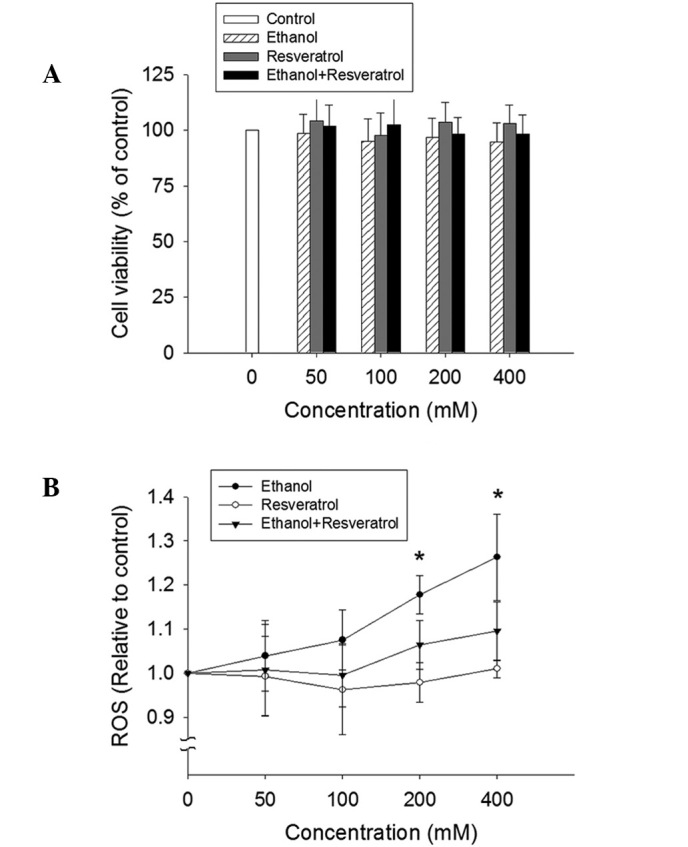
Figure 2.

Effect of ethanol and resveratrol on cell viability and ROS production. (A) HepG2 cells were treated with 50, 100, 200 and 400 mM ethanol, resveratrol, and ethanol plus resveratrol for 24 h. The impact of resveratrol on cell viability was assessed using an MTT assay. All values are expressed as a percentage of the control group, which is set as 100%. (B) ROS production was determined by the conversion of 2′,7′-dichlorodihydrofluorescein diacetate to 2′,7′-dichlorodihydrofluorescein. The results were expressed as the relative fluorescence intensity compared to the control, which is set as 1. Data are presented as the mean ± standard error (n=3-5) *P<0.05, vs. control. ROS, reactive oxygen species.
