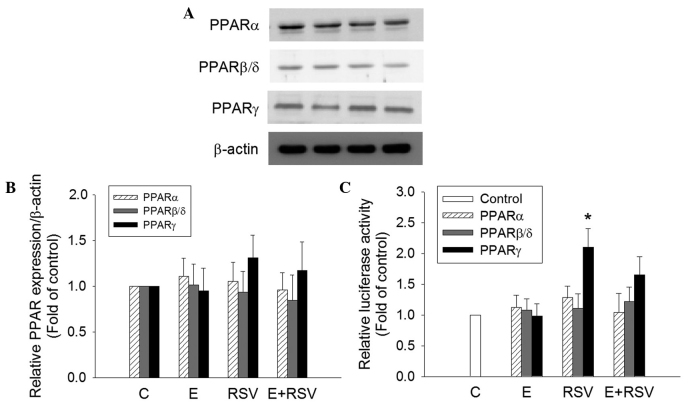
Figure 5.
Effect of E and RSV on PPAR expression and activity. (A) Relative protein expression levels of PPARα, PPARβ/δ, and PPARγ were measured using western blot analysis of nuclear extracts from HepG2 cells supplemented with ethanol and/or RSV for 24 h. (B) The fold inductions of PPAR protein levels were expressed relative to the control, which is set as 1. Data are presented as the mean ± standard error (n=4). (C) Transcriptional activity of PPARα, PPARβ/δ, and PPARγ were evaluated by transfection assays using HepG2 cells with PPRE-luc together with pGSH PPARα, pCMX-hPPARβ/δ or pCMX-hPPARγ plasmids, respectively. Results are presented as the relative luciferase activity obtained by dividing normalized luciferase activity from the reporter vector PPRE-luc. *P<0.05 vs. control cells (n=4). PPAR, proliferator-activated receptor; C, control; E, ethanol; RSV, resveratrol.

