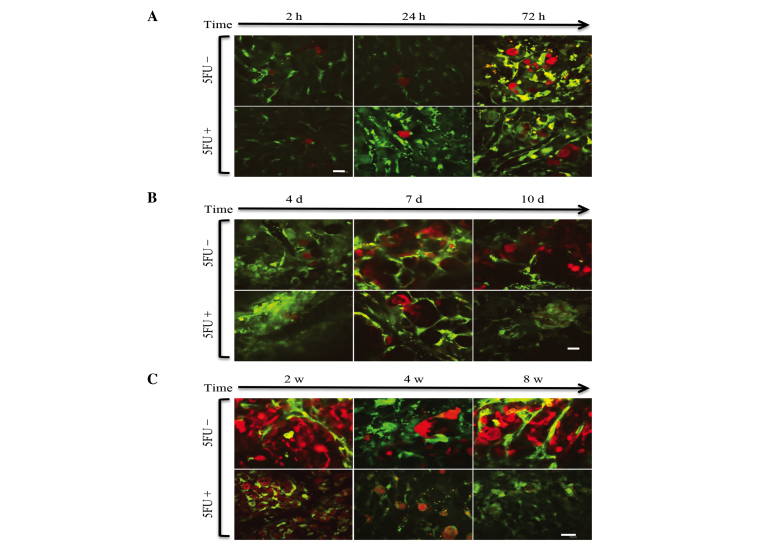
Figure 4.
(A) Early-stage TPLSM images of the liver in each group. Representative images were taken in the same mouse. Arrested tumor cells in the hepatic sinusoid gradually reduced over time. Images were captured 2, 24, and 72 h after the injection of tumor cells in 5FU-treated and untreated mice (scale bar, 20 µm). (B) Middle stage of time course TPLSM images of the liver in each group. Representative images were captured in the same mouse, 4, 7 and 10 days after injection with or without 5FU treatment. Cell fragments due to apoptosis were observed (scale bar, 20 µm). (C) Late-stage TPLSM images of the liver in each group. Representative images were captured in the same mouse, 2, 4, and 8 w after the injection of tumor cells in 5FU-treated and untreated mice. Extravasated tumor cells in the hepatic tissues (scale bar, 20 µm).

