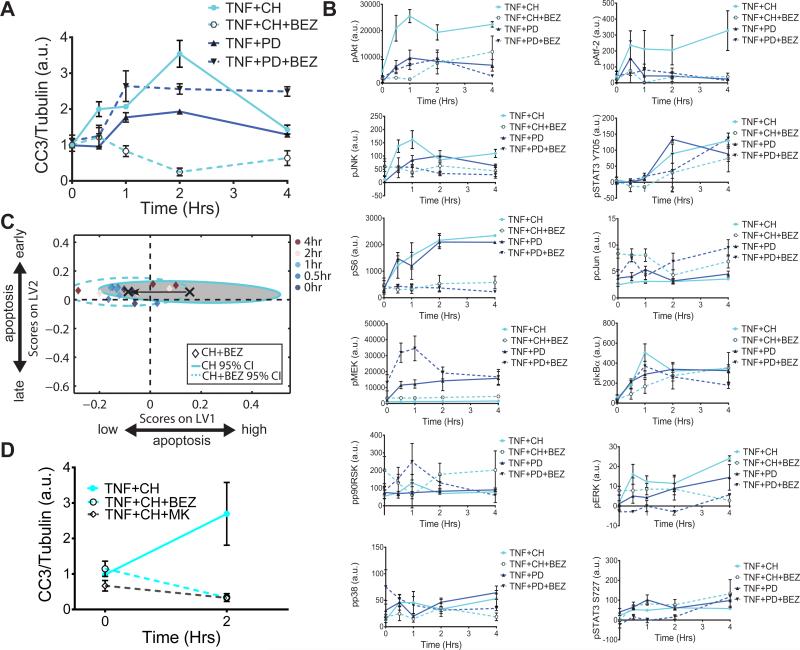
Fig. 5. Global network shifts govern the apoptotic response to the combinatorial application of MEK and Akt inhibitors.
(A and B) Mice were pretreated with the MEK inhibitor PD325901 (PD) or the MEK inhibitor CH5126766 (CH) in the presence or absence of the PI3K inhibitor NVP-BEZ235 (BEZ), as indicated, before being treated with TNF-α for the indicated times. Intestinal epithelia from the mice were then analyzed by quantitative Western blotting or Bio-Plex to determine (A) the relative abundance of cleaved caspase-3 (CC3), normalized to that of tubulin, as an indicator of apoptosis, and (B) the relative abundances of the indicated phosphoproteins. Data in (A) are means ± SEM of three experiments per time point, whereas data in (B) are means ± SEM of three or four experiments per time point. (C) The computational D-PLSR model derived from the DMSO, CH5126766-treated, and PD325901-treated conditions (from Fig. 3B). X's and ellipses represent centroids and 95% confidence intervals (CIs) (34) for the CH and CH+BEZ treatment groups, respectively. (D) Mice were pretreated with the MEK inhibitor CH5126766 (CH) in the presence or absence of the PI3K inhibitor NVP-BEZ235 (BEZ) or the Akt inhibitor MK2206 (MK), as indicated, before being treated with TNF-α for the indicated times. Intestinal epithelia from the mice were then analyzed by quantitative Western blotting or Bio-Plex to determine the relative abundance of cleaved caspase-3 (CC3), normalized to that of tubulin. Data are means ± SEM of two to five experiments per time point.

