
Fig. 1.
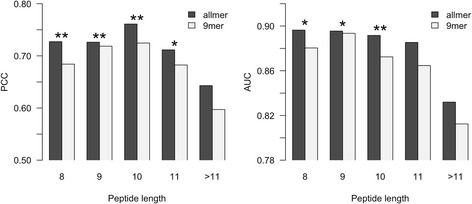
Predictive performance on different peptide lengths for the allmer and 9mer predictive methods. The two methods were trained as described in the text. The predictive performance was measured in terms of Pearson’s correlation coefficient (PCC) and area under the ROC curve (AUC), the latter using a binding threshold of 500 nM. The allmer method significantly outperforms the 9mer approach on peptides of all lengths from 8 to 10 (binomial test excluding ties). **: p < 0.001, *: p < 0.05