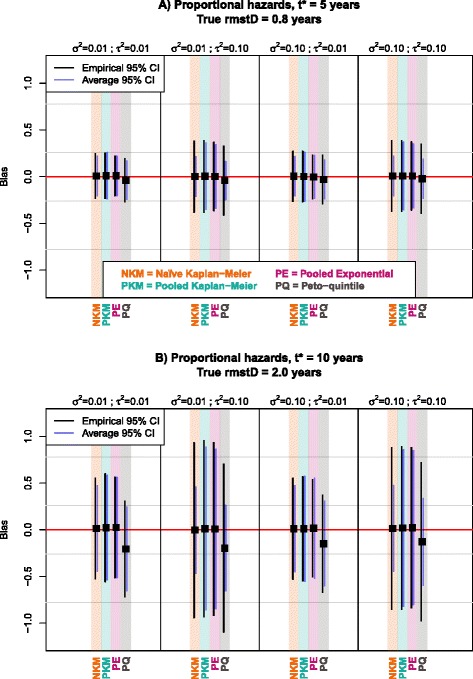
Fig. 1.

Graphical comparison at 5 years (panel a) and at 10 years (panel b) of methods in terms of bias, empirical and average standard error with proportional hazards; 5 trials and 200 patients per trial; β = −0.7. Black squares represent the average bias of the rmstD estimated by each method for a particular scenario. Black and purple vertical lines represent the 95 % confidence intervals of the bias based on respectively the empirical and average standard errors. The horizontal red line indicates the absence of bias in the rmstD estimation. β: Size of treatment effect (=log(HR)); σ2: baseline hazard heterogeneity; τ2: treatment effect heterogeneity; CI: Confidence interval; rmstD: difference in restricted mean survival time
